Make your own SVG graph with react-native-svg and D3.js
9 April 2019
Drawing graphs with React native is easier said than done. There are librairies which propose some ready to use graphs, but most of the time you’ll want to create your own, with your specific design. The goal of this article is to guide you trough the process of creating your own graph from scratch.
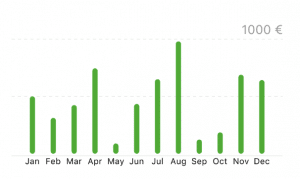
The graph we are going to build is the following:

Install the dependencies
As mentioned in the title: we need two libraries, react-native-svg and d3.js.
Let’s draw!
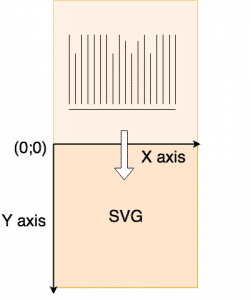
The bar chart we are trying to draw is displayed from bottom to top. The problem is that SVG’s Y coordinate works from top to bottom. We are going to use a technique to simplify the drawing.
We will draw the graph with negative Y coordinate, which will be simpler. For exemple, for a value of 5, we will draw a bar from 0 to -5.
Finally, we need to translate the graph, because right now, it is out of the SVG viewport.
Let’s do this for real now.
Let’s put a Rect in the SVG so we can see something.
We translate the graph on the Y axis for the graph height. Note that the Rect Y coordinate is -15 because we drew the Rect outside of the SVG viewport, and then translated it inside. You can try this component and you should be able to see the Rect.
Axis generation
We will start with the bottom axis. The diagram we previously saw was simplified to understand the translation. Y=0 is the bars starting coordinate. We define the graph margins which is where everything around the graph will be (Jan, Feb, … for exemple).

If you look closely, you will see that the bottom axis a little bit detached from the graph. Since we are drawing with negative coordinate and we want it under the graph, we are going to give the axis Y=2 coordinate.
Bar generation
Bars on this graph are just Rect with a border radius. At this point we will need some data. Our bar chart data is going to be an ordered list of key-value pairs. In javascript, we’ll represent this with an array of objects.
Note: I am skipping all the props validation part for the tutorial because I want it as simple as possible.
How do we decide which x, y height and width to give to the Rect?
We need to keep in mind that the height works like the SVG, from top to bottom, even though we are drawing in negative coordinate. It means that the starting point (x, y) will be the top of the Rect, and the height represent the distance between the starting point and the bottom (Y=0). Here is an illustration to understand the concept:

Bars position and height
Now the hard part is to find x and y. What we want to achieve is that the highest value goes to the top of the graph, so we need the bars to scale depending on the top value.
Let’s use d3-scale Point scales and d3-scale Linear scales for this. In a nutshell, the scales allow us to define a specific range and a specific domain, and we will use these scales to define x and y. The only notable thing we are going to do after the scales calculation is to remove half the bar width to the X coordinate. Since it is a point scale, the points are not supposed to have width, so we consider the points as the center of our bars.
Note: I did not use band scales because they have a fixed padding and a variable width for the bar and I needed the opposite, a fixed width for the bar and a variable padding. It was easier with a point scale for me, but if you need a variable width, band scale is the way to go for the x coordinate.
With this code, we have created the following graph:
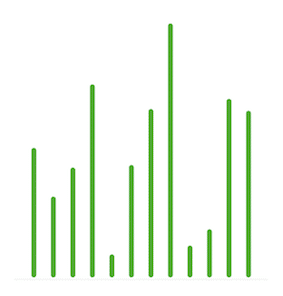
Bar chart
Add some details
We will then add some details using components you already used. We will draw two dashed lines: one on the top, one in the middle. We will add a label on top of the top dashed line with a rounded top value and the unit. Round and unit will be two new props.
Here is the final code:
Here is the final result:
I hope you enjoyed this tutorial. There is a lot more you can do with D3.js and react-native-svg. This little tour should help you get confortable with the basics and give you what you need to create your own beautiful graphs.

Expert technique
Comments
